Author: israel Rolon

  • Providence Condominium Market Update for W34 2026

    Providence Condominium Market Update for W34 2026

    This Weekly Providence CN real estate market report summarizes recent sales and listing activity using MLS-recorded transaction data from riar.

    Metrics are derived directly from recorded listing and sales activity during the period and include measures of transaction volume, pricing trends, time on market, and buyer competition. The narrative is generated systematically from underlying data to provide a consistent, objective view of current market conditions.

    Compared with the same week last year, pricing conditions in W34 2026 were mixed.

    Sales activity cooled at 2 condo listings sold, 60.0% lower than 5.

    The median sale price was $403,750, down 29.2% from $570,000.

    Homes spent a median of 129 days on market, up 138.9% from 54 days.

    100% of homes sold above asking price, up from 60%, signaling stronger buyer competition.

    Looking at week-to-week momentum, conditions shifted from the prior period.

    A notable development this period: buyer leverage increased, with the share of homes selling above asking at its lowest level on record.

  • Boston Single-Family Market Update for W34 2026

    Boston Single-Family Market Update for W34 2026

    This Weekly Boston SF real estate market report summarizes recent sales and listing activity using MLS-recorded transaction data from mlspin.

    Metrics are derived directly from recorded listing and sales activity during the period and include measures of transaction volume, pricing trends, time on market, and buyer competition. The narrative is generated systematically from underlying data to provide a consistent, objective view of current market conditions.

    Compared with the same week last year, pricing conditions in W34 2026 were mixed.

    Sales activity remained steady at 9 single-family listings sold, closely matching the prior period’s 9.

    The median sale price was $965,000, down 11.9% from $1,095,000.

    Homes spent a median of 76 days on market, up 11.8% from 68 days.

    44% of homes sold above asking price, up from 11%, signaling stronger buyer competition.

    Looking at week-to-week momentum, conditions shifted from the prior period.

  • Providence Single-Family Market Update for W34 2026

    Providence Single-Family Market Update for W34 2026

    This Weekly Providence SF real estate market report summarizes recent sales and listing activity using MLS-recorded transaction data from riar.

    Metrics are derived directly from recorded listing and sales activity during the period and include measures of transaction volume, pricing trends, time on market, and buyer competition. The narrative is generated systematically from underlying data to provide a consistent, objective view of current market conditions.

    Compared with the same week last year, pricing conditions in W34 2026 were mixed.

    Sales activity cooled at 7 single-family listings sold, 58.8% lower than 17.

    The median sale price was $550,000, up 21.0% from $454,400.

    Homes spent a median of 51 days on market, down 28.2% from 71 days.

    0% of homes sold above asking price, down from 29%, suggesting easing buyer competition.

    Looking at week-to-week momentum, conditions shifted from the prior period.

  • Greenlit’s Weekly Digest: Treasury Steps In, Rates Snap Back.

    Greenlit’s Weekly Digest: Treasury Steps In, Rates Snap Back.

    We’re back with another Weekly Digest, and apparently the market decided it wasn’t going to give us a quiet week.

    Before we get into rates, Treasury buybacks, fuel prices, and whatever else decided to move the market this week, we actually have some Greenlit news to share.

    What’s New at Greenlit

    We released a new Greenlit Update this week covering some of the work we’ve been doing behind the scenes.

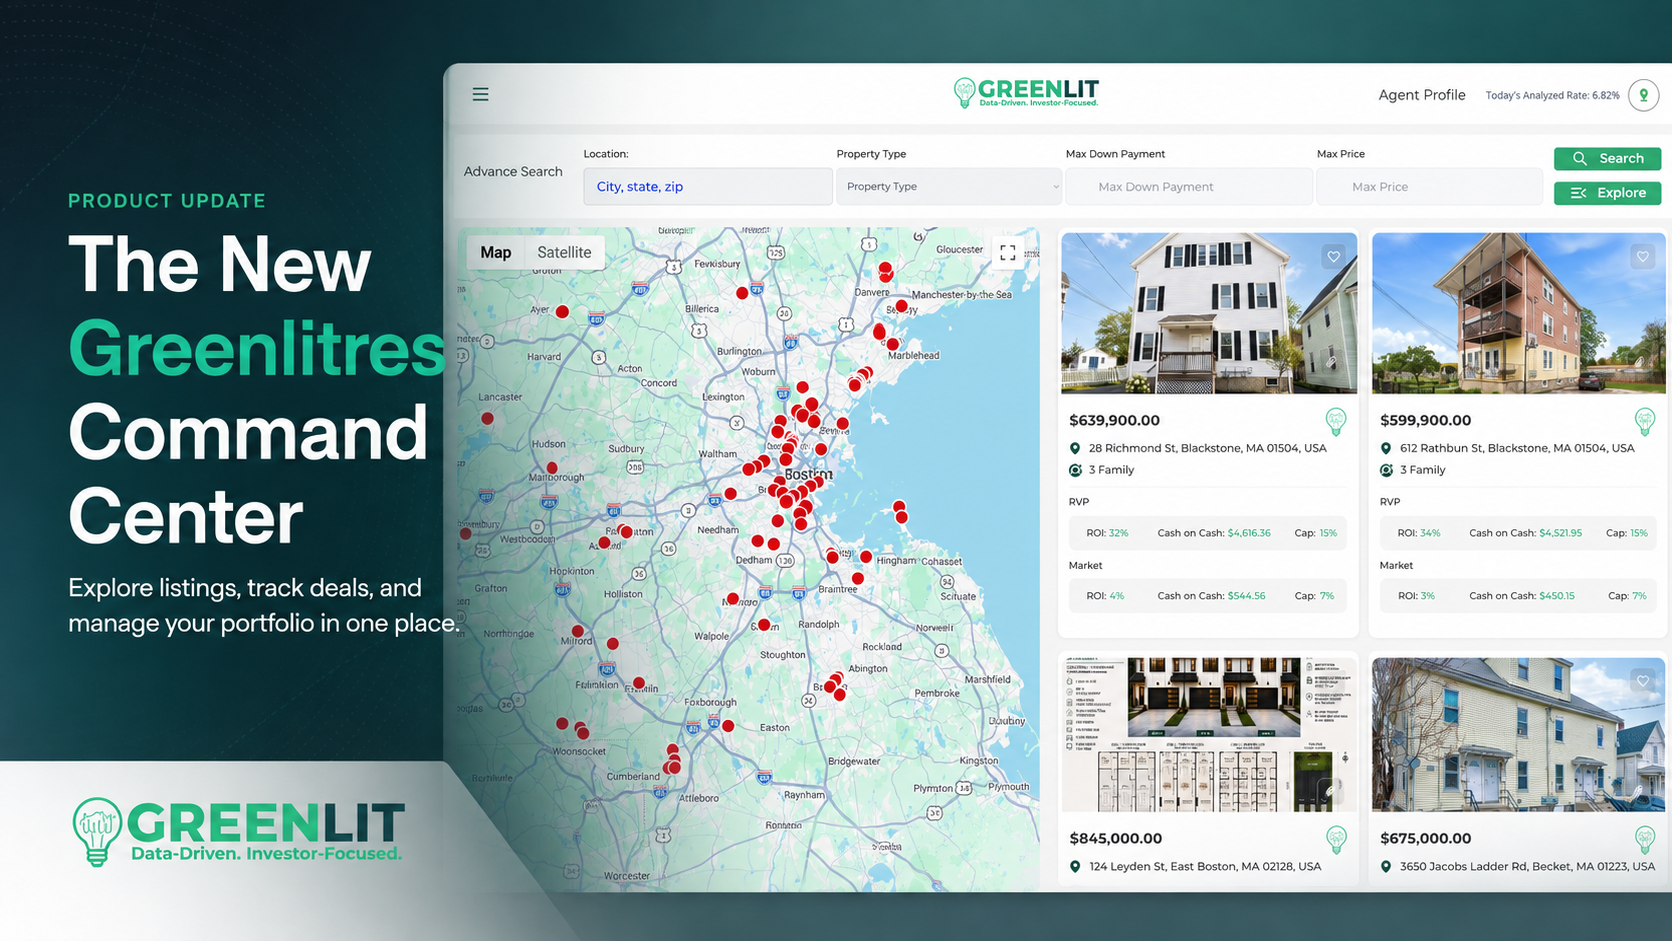
    The biggest change is our new Command Center, which takes the old search experience and turns it into one central place to search for properties, revisit favorites, manage active deals, and keep track of properties you already own.

    We’ve also been cleaning up and improving several other parts of the platform, with more updates already in progress.

    If you haven’t been on Greenlit in a little while, now might be a good time to take another look.

    Explore Greenlit →

    Now, let’s talk about this ridiculous week for rates.

    Economic Note

    Well, that didn’t last very long.

    We started the week with mortgage rates sitting around 6.69%, and after everything that happened last week, we were expecting them to remain relatively flat while the market waited for next week’s PCE report.

    Then Treasury Secretary Scott Bessent decided to shake things up.

    The Treasury announced that it would significantly increase its buybacks of longer term government debt, a move aimed at relieving some of the pressure we’ve been seeing on long term Treasury yields.

    And for about a day, it worked.

    The 10 year dropped pretty aggressively following the announcement, giving us what looked like a legitimate shot at another meaningful decline in mortgage rates.

    But the problem is that Treasury buybacks don’t make everything else happening in the world disappear.

    Fuel prices remain elevated, inflation concerns haven’t gone anywhere, government borrowing remains enormous, and geopolitical uncertainty continues to hang over the market.

    So almost as quickly as the 10 year dropped, it turned around and climbed right back up.

    By the end of the week, we were essentially back where we started, with mortgage rates around 6.72% and the 10 year actually trading slightly higher than it was before the Treasury announcement.

    So what did we learn?

    Apparently even a surprise move from the Treasury Department can only keep this market optimistic for about 24 hours.

    That brings us to next week and the PCE inflation report.

    At this point, the market seems to be having a hard time holding onto any good news, which makes next week’s report even more important. If PCE comes in better than expected, we may finally get another legitimate push downward in rates.

    If it disappoints?

    After watching the market completely erase this week’s rally, we wouldn’t be surprised to see rates move higher again.

    We’ll find out next week.

    Market Reports

    Greenlit Updates

    Greenlit is now in user trials.

    Explore the platform, test the investment tools, and see how we’re building a better way to find and manage real estate.

  • Greenlit Update: The New Command Center

    Greenlit Update: The New Command Center

    Over the past two weeks, we’ve been focused on one big goal: making Greenlitres feel less like a collection of separate real estate tools and more like one connected investing platform.

    A lot of that work centered around the Search experience, but what started as a search-page update turned into something much bigger. We rebuilt the page into a true Greenlitres Command Center, improved how searches behave behind the scenes, expanded the way users can interact with active deals and portfolio properties, and cleaned up a significant amount of legacy architecture along the way.

    Here’s what we delivered.

    A New Greenlitres Command Center

    The biggest visible change is the redesigned Search experience.

    Instead of treating Search as a basic listing-results page, we’ve turned it into a central place for navigating the major parts of the Greenlitres investing experience.

    Users can now move more naturally between:

    • Explore Listings
    • Simple Search
    • Advanced Search
    • Active Deals
    • Saved Properties
    • Portfolio
    • Financial Assumptions
    • Investment Buy Box

    The top of the page now includes a cleaner simple-search experience built around the most important starting filters: location, property type, maximum down payment, and maximum purchase price. The interface also clearly shows which part of Greenlitres you’re currently using, whether you’re exploring listings, looking at active deals, reviewing saved properties, or working with your portfolio.

    We also rebuilt the Explore and Controls menu to make the different parts of Greenlitres easier to understand and access without disrupting the map or property results underneath it.

    The result is a Search page that now behaves much more like the central command center for the platform.

    Simple Search and Advanced Search Finally Work Together

    One of the less visible, but more important, updates involved fixing how Simple Search and Advanced Search communicate with each other.

    Previously, it was possible to run an Advanced Search in one location, switch back to Simple Search, enter a different location, and still end up looking at results from the previous search. In some cases, the two search interfaces could even display different locations at the same time.

    That obviously isn’t the experience we want.

    We traced the problem through the underlying search workflows and rebuilt the way search state is managed so the different parts of the interface now reference the same canonical search state.

    In simpler terms: when you change your search, Greenlitres now does a much better job of knowing what you actually asked it to search for.

    We also fixed the default map behavior so users without an active location search are taken to their current geographic area instead of landing on an unrelated default location.

    Active Deals Are Now Part of the Same Experience

    We’ve also continued bringing the deal-management side of Greenlitres into the Command Center.

    Active Deals now uses the same core map and property interface as listing exploration, while changing the underlying data to show properties the user is actively tracking.

    We added Deal Stage filtering and established the foundation for additional deal-specific search controls, including location and target closing date.

    The bigger idea here is important.

    Greenlitres shouldn’t stop being useful once you find a property you’re interested in.

    Discovery is only the beginning of the investment process, and we want the platform to continue supporting investors as properties move from potential opportunity to active deal.

    A More Useful Portfolio Experience

    We also expanded the Portfolio side of the platform.

    Portfolio search now supports location filtering and new controls around:

    • Lease Status
    • Performance
    • Needs Attention

    Lease Status can distinguish between fully occupied, partially occupied, and vacant properties, while the Performance filters are being structured around whether a property is cash-flow positive, breaking even, or cash-flow negative.

    We also simplified the underlying Portfolio search workflow so changing filters no longer requires unnecessary page reloads.

    That may sound like a small technical change, but it contributes to something we care about a lot: making Greenlitres feel faster and more natural to use.

    Cleaning Up the Platform Behind the Scenes

    Not every meaningful product improvement is something users can immediately see.

    While reviewing platform performance, we discovered that an old legacy property-details page was responsible for a surprisingly large amount of application workload, even though it is no longer the page used by the current Greenlitres experience.

    Further investigation revealed that a number of older test pages, retired search experiences, experiments, and legacy workflows were still referencing pieces of the old architecture.

    So we did a major cleanup.

    A large number of obsolete pages, old search implementations, test pages, sample experiments, old profile versions, and legacy workflows were removed from the application.

    The immediate benefit is a cleaner platform that is easier to maintain and reason about. We’ll also be monitoring the impact this cleanup has on workload and overall performance.

    Building a Better Website Foundation

    The cleanup also exposed another area that deserved more structure: the Greenlitres website itself.

    We created a new SEO and Page Inventory tracker that now documents every surviving page in the application along with its purpose, current status, replacement pages, entry points, SEO indexing status, titles, descriptions, canonical settings, sitemap decisions, workload concerns, and future updates.

    What began as an SEO inventory has effectively become our master website-cleanup plan.

    That gives us a much clearer picture of what is current, what is legacy, what needs improvement, and what should eventually disappear entirely.

    A Small but Encouraging Test

    One of our favorite pieces of feedback from this update came from an existing Greenlitres user.

    After seeing the redesigned interface, the immediate reaction was essentially:

    “Thank god.”

    Sometimes that’s all the usability testing you need.

    The old experience clearly had friction, and seeing an immediate positive reaction to the new structure was a good sign that the Command Center is moving in the right direction.

    What’s Next

    The Command Center rebuild itself is essentially complete.

    Our next round of work is going to focus less on adding something brand new and more on tightening up the foundation we just uncovered.

    Next on the list:

    • Improve Deal Tracker records so location filtering can use a clean, normalized city field.
    • Make sure Portfolio records consistently store Lease Status and Needs Attention information.
    • Normalize inconsistent MLS property types into stable Greenlitres categories while preserving the original MLS property-type detail.
    • Continue cleaning up remaining website pages and legacy workflows.
    • Update the pages we’re keeping so they are visually and functionally consistent with the current Greenlitres experience.
    • Work through SEO titles, descriptions, canonical settings, sitemap decisions, and indexing rules across the site.
    • Monitor Bubble workload after the legacy-page cleanup to confirm the performance impact.

    Once that cleanup cycle is finished, we’ll take another look at the platform and decide what the next major product priority should be.

    Have an Idea for Greenlitres?

    We’re also opening the door a little wider for user input.

    If you’re using Greenlitres and there’s something you wish the platform could do, tell us.

    It could be a feature, a filter, a workflow, a report, a piece of data you wish you could see more easily, or even one of those random “you know what would actually be useful?” ideas.

    We’re actively building and refining the platform, and user insight is one of the best ways for us to figure out what deserves attention next.

    We can’t promise that every idea will make it into the product, but if something makes sense for real estate investors and fits where Greenlitres is going, there’s a very real chance we’ll throw it into the roadmap.

    Once this cleanup cycle is complete, we’ll look at the platform, the feedback we’ve received, and decide what comes next.

    For now, the goal is straightforward: keep tightening the foundation so whatever we build next starts from a cleaner, faster, and more connected Greenlitres.

  • Providence Multi-Family Market Update for W33 2026

    Providence Multi-Family Market Update for W33 2026

    This Weekly Providence MF real estate market report summarizes recent sales and listing activity using MLS-recorded transaction data from riar.

    Metrics are derived directly from recorded listing and sales activity during the period and include measures of transaction volume, pricing trends, time on market, and buyer competition. The narrative is generated systematically from underlying data to provide a consistent, objective view of current market conditions.

    Compared with the same week last year, pricing conditions in W33 2026 were mixed.

    Sales activity cooled at 2 multi-family listings sold, 66.7% lower than 6.

    The median sale price was $796,500, up 14.3% from $697,000.

    Homes spent a median of 57 days on market, down 8.1% from 62 days.

    50% of homes sold above asking price, indicating stable buyer competition.

    Looking at week-to-week momentum, conditions shifted from the prior period.

  • Boston Multi-Family Market Update for W33 2026

    Boston Multi-Family Market Update for W33 2026

    This Weekly Boston MF real estate market report summarizes recent sales and listing activity using MLS-recorded transaction data from mlspin.

    Metrics are derived directly from recorded listing and sales activity during the period and include measures of transaction volume, pricing trends, time on market, and buyer competition. The narrative is generated systematically from underlying data to provide a consistent, objective view of current market conditions.

    Compared with the same week last year, pricing conditions in W33 2026 were mixed.

    Sales activity remained steady at 4 multi-family listings sold, closely matching the prior period’s 0.

    The median sale price was virtually unchanged at $1,175,000.

    Homes spent a median of 169 days on market, virtually unchanged.

    25% of homes sold above asking price, up from , signaling stronger buyer competition.

    Looking at week-to-week momentum, conditions shifted from the prior period.

  • Providence Condominium Market Update for W33 2026

    Providence Condominium Market Update for W33 2026

    This Weekly Providence CN real estate market report summarizes recent sales and listing activity using MLS-recorded transaction data from riar.

    Metrics are derived directly from recorded listing and sales activity during the period and include measures of transaction volume, pricing trends, time on market, and buyer competition. The narrative is generated systematically from underlying data to provide a consistent, objective view of current market conditions.

    Compared with the same week last year, pricing conditions in W33 2026 were mixed.

    Sales activity cooled at 3 condo listings sold, 66.7% lower than 9.

    The median sale price was $870,000, up 83.2% from $475,000.

    Homes spent a median of 70 days on market, up 34.6% from 52 days.

    0% of homes sold above asking price, down from 44%, suggesting easing buyer competition.

    Looking at week-to-week momentum, conditions shifted from the prior period.

  • Boston Condominium Market Update for W33 2026

    Boston Condominium Market Update for W33 2026

    This Weekly Boston CN real estate market report summarizes recent sales and listing activity using MLS-recorded transaction data from mlspin.

    Metrics are derived directly from recorded listing and sales activity during the period and include measures of transaction volume, pricing trends, time on market, and buyer competition. The narrative is generated systematically from underlying data to provide a consistent, objective view of current market conditions.

    Compared with the same week last year, pricing conditions in W33 2026 were mixed.

    Sales activity cooled at 58 condo listings sold, 26.6% lower than 79.

    The median sale price was $724,125, down 4.7% from $760,000.

    Homes spent a median of 108 days on market, up 37.8% from 78 days.

    17% of homes sold above asking price, down from 58%, suggesting easing buyer competition.

    Looking at week-to-week momentum, conditions shifted from the prior period.

    Over the past 3 weeks, median sale prices for condo properties have trended higher.

  • Providence Single-Family Market Update for W33 2026

    Providence Single-Family Market Update for W33 2026

    This Weekly Providence SF real estate market report summarizes recent sales and listing activity using MLS-recorded transaction data from riar.

    Metrics are derived directly from recorded listing and sales activity during the period and include measures of transaction volume, pricing trends, time on market, and buyer competition. The narrative is generated systematically from underlying data to provide a consistent, objective view of current market conditions.

    Compared with the same week last year, pricing conditions in W33 2026 were mixed.

    Sales activity cooled at 8 single-family listings sold, 27.3% lower than 11.

    The median sale price was $493,500, down 21.0% from $625,000.

    Homes spent a median of 54 days on market, down 19.4% from 67 days.

    13% of homes sold above asking price, down from 55%, suggesting easing buyer competition.

    Looking at week-to-week momentum, conditions shifted from the prior period.